vue-chrts
443
Stars
26
Forks
4
Watchers
9
Open Issues
MIT
许可证
Vue
语言
2025-03-16
创建时间
2026-11-07
最近更新
项目能做什么
受 Tremor 启发、基于 Unovis 构建的 Vue 3 图表组件库。
来源:基于仓库元数据
· 内容以仓库实际 README 为准
使用说明 查看原始 README 原仓库文档
中文使用说明暂未生成。下面保留原仓库 README 摘录,命令与配置均以原文为准。
原始 README 摘录(英文原文,节选前 3000 字符)
# Vue-chrts
This is a monorepo for [vue-chrts](https://github.com/dennisadriaans/vue-chrts/tree/main/packages/vue), the legacy Nuxt module, and the next `nuxt-charts` module.
A Vue 3 charts package inspired by [Tremor](https://tremor.so/), built on top of [Unovis](https://unovis.dev). Vue-Chrts provides beautiful, responsive charts for your Vue applications with minimal setup.
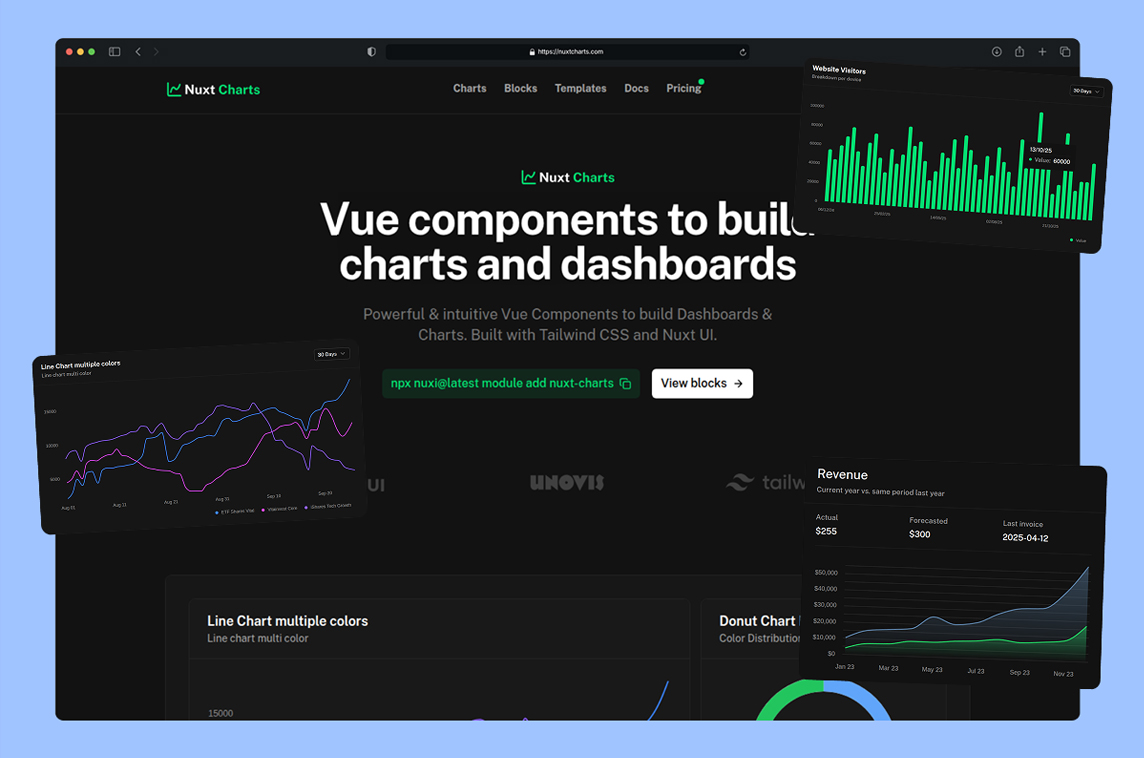
[Check the docs and examples](https://nuxtcharts.com/docs)
## Features
- 📊 Multiple chart types: Line, Bar, Area, Stacked Area, Donut
- 🎨 Customizable
- 📱 Responsive design
- 💡 Simple, intuitive API
- 🚀 Built with Vue 3 and TypeScript
[Check the docs and examples](https://nuxtcharts.com/docs)
## Installation Nuxt
```bash
# npm
npm install nuxt-charts
# yarn
yarn add nuxt-charts
# pnpm
pnpm add nuxt-charts
# Add module to your nuxt.config.ts
export default defineNuxtConfig({
modules: ["nuxt-charts"]
});
```
## Installation Vue.js
```bash
# npm
npm install vue-chrts
# yarn
yarn add vue-chrts
# pnpm
pnpm add vue-chrts
# import component
import { LineChart } from 'vue-chrts';
```
[Check the docs and examples](https://nuxtcharts.com/docs)
## Usage Example
```vue
<script setup>
import { LineChart } from 'vue-chrts';
const data = [
{ month: 'Jan', sales: 100, profit: 50 },
{ month: 'Feb', sales: 120, profit: 55 },
{ month: 'Mar', sales: 180, profit: 80 },
{ month: 'Apr', sales: 110, profit: 40 },
{ month: 'May', sales: 90, profit: 30 },
];
const categories = {
sales: {
name: 'Sales',
color: '#3b82f6'
},
profit: {
name: 'Profit',
color: '#10b981'
}
};
const xFormatter = (i) => data[i].month;
</script>
<template>
<LineChart
:data="data"
:categories="categories"
:height="300"
:xFormatter="xFormatter"
xLabel="Month"
yLabel="Amount"
/>
</template>
```
[Check the docs and examples](https://nuxtcharts.com/docs)
## Available Charts
- `LineChart`
- `BarChart`
- `AreaChart`
- `AreaStackedChart`
- `DonutChart`
## Vue charts
Make better dashboards with with [Vue charts](https://nuxtcharts.com/vue-charts) This library simplifies the process of integrating beautiful Vue charts into any modern web application or dashboard.
## Credits
This library is inspired by [Tremor](https://tremor.so/) and built on top of [Unovis](https://unovis.dev).
## Angular
Looking for the Angular charts variant? Check the [Angular Charts](https://angularcharts.com/) website or the [GitHub](https://github.com/dennisadriaans/angular-chrts) repo here.
## License
MIT
阅读完整原文
项目深度分析 规则生成(AI 未配置)
综合评分 41.0 分。该项目在“个人可实施性”维度得 55 分,“付费可能性”维度得 20.0 分,差异化空间 45.0 分(评分依据见评分卡)。
面向细分需求的二次开发产品
| 产品构想 | 基于 vue-chrts 的核心能力,聚焦一个更窄的场景(如某平台、某行业)做差异化。 |
| 目标用户 | 该细分场景用户 |
| 难度/周期 | 中 · 2~6 周 |
| 收费模式 | 买断制 / 订阅制 / 广告 |
| 竞争风险 | 细分需求规模需验证 |
| 依据 | AI 推测:基于项目主题标签的判断 |
以上为规则引擎基于仓库公开数据生成的参考结论,包含推测成分,不构成投资或创业承诺;配置 AI 后可获得更深入的分析。
报告会保存到 个人中心
竞品与相似项目 GitHub Search 真实检索
以上为通过 GitHub 官方 Search API 检索的相似项目,功能差异与优劣势需进一步人工确认,配置 AI 后可生成对比分析。
项目优势与风险
| 技术成熟度 | 创建于 2025-03-16,近 30 天仍在推送,发布过 35 个 Release |
| 社区活跃 | Star 443 / Fork 26 / Issue 9(数据支持,可自行核实) |
| 许可证 | MIT |
| 主要风险 | 上游项目方向可能变化;同赛道竞争者较多(见竞品表);热度与需求不完全等价 |
安装与使用
此项目未提供 Docker 镜像,安装步骤以原仓库 README 为准(涉及依赖安装与环境配置,对新手门槛较高)。